
Bitcoin is close to $70,000. What will happen to TON, STX, MNT, and MKR in the future?

Author: Rakesh Upadhyay, CoinTelegraph; Compiler: Deng Tong, Golden Finance
BTC is down about 2% this week, but a positive sign for bulls is that the price has moved away from the weekly low of $64,493. Some analysts expect the next trigger to be the Bitcoin halving. However, cryptocurrency exchange Coinbase warns that Bitcoin's price action after the halving event may face obstacles as this period is usually a weak period of the year for crypto markets and other risk assets.
While the upside looks open, the downside may be limited. Dylan LeClair, senior analyst at UTXO Management, believes that even if there is a decline, Bitcoin is unlikely to fall to $50,000, when a large number of longs may be eliminated. However, he warned that nothing is impossible in the cryptocurrency market.
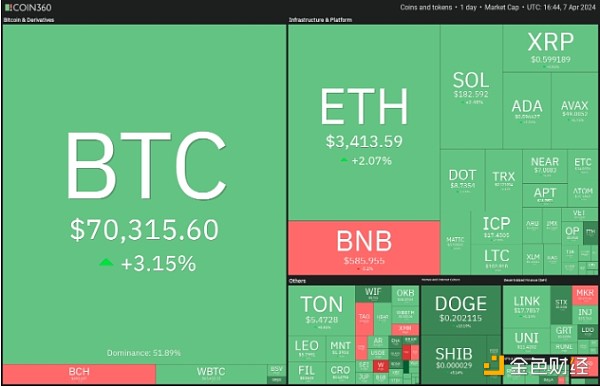
Cryptocurrency market data daily view. Source: Coin360
While Bitcoin has been leading the market higher, some altcoins have performed well. Pantera Capital's Liquid Token fund said in a shareholder letter reviewed by Bloomberg that it cut its investments in Bitcoin and Ethereum and increased its allocation to DeFi tokens, which helped it achieve a 66% return in the first quarter of 2024.
Will certain altcoins continue to outperform Bitcoin in the short term? Let’s examine the top 5 cryptocurrencies that appear to be performing the strongest on the charts.
Bitcoin Price Analysis
Bitcoin has been oscillating inside a symmetrical triangle pattern for the past few days, suggesting indecision about the next move.
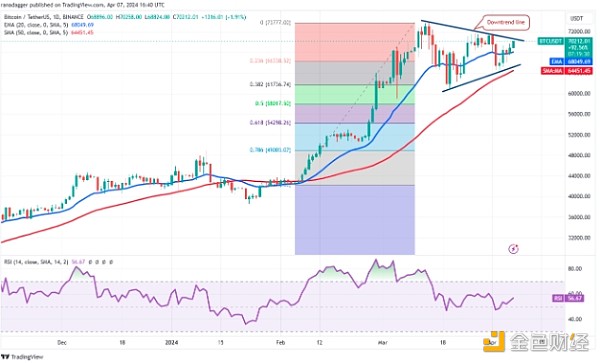
BTC/USDT daily chart. Source: TradingView
The 20-day exponential moving average ($68,049) continues to gradually rise and the relative strength index (RSI) is in the positive territory suggesting a slight advantage for the bulls. A breakout and close above the triangle will indicate that the uncertainty has been resolved in favor of the buyers. The BTC/USDT trading pair could rise to $73,777 and eventually to $80,000.
Conversely, if the price turns lower from the downtrend line and breaks below the 20-day EMA, it will suggest that the trading pair is likely to extend its stay inside the triangle. On a break below the triangle, the advantage will tilt in favor of the bears. This could start a decline to $59,000 and then to the 61.8% Fibonacci retracement level of $54,298.
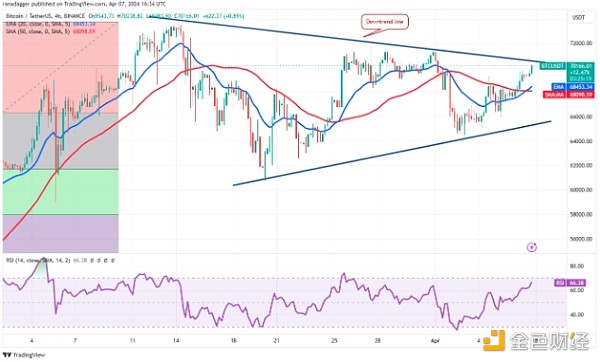
BTC/USDT 4-hour chart. Source: TradingView
The 20-day EMA has started to turn up and the RSI is in the positive zone on the 4-hour chart, which shows that bulls have the upper hand. The uptrend is likely to face stiff resistance at the downtrend line, but if the bulls overcome this hurdle, the consolidation phase is likely to end. The pair could move up to $72,000 and later to $73,777.
Contrary to this assumption, if the price turns down and breaks below the moving averages, it will suggest that the bears are unwilling to give up. The pair is then likely to slide towards the support line of the triangle. Sellers will have to pull the price below this level to indicate the start of a decline towards $59,000.
Toncoin Price Analysis
Toncoin (TON) is gradually moving higher towards the overhead resistance at $5.69, suggesting that the bulls are attempting to regain control.
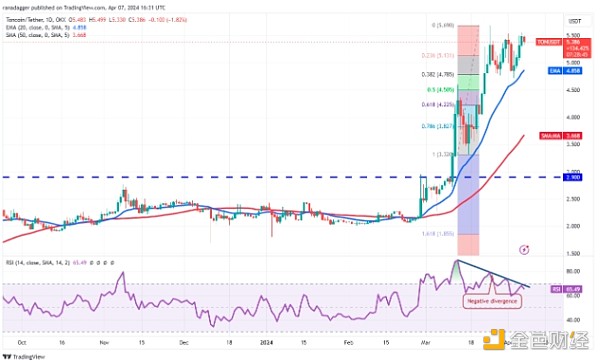
TON/USDT daily chart. Source: TradingView
Although the rising 20-day EMA ($4.86) suggests that buyers have the upper hand, the negative divergence on the RSI suggests that a consolidation or correction is likely in the near term. If the price turns down from the current levels ($5.69), it will suggest that the bears are aggressively defending the overhead resistance. This could pull the price down to the 20-day EMA.
On the other hand, if the buyers break the $5.69 resistance, the TON/USDT trading pair is likely to start the next leg of the uptrend towards $7.09.
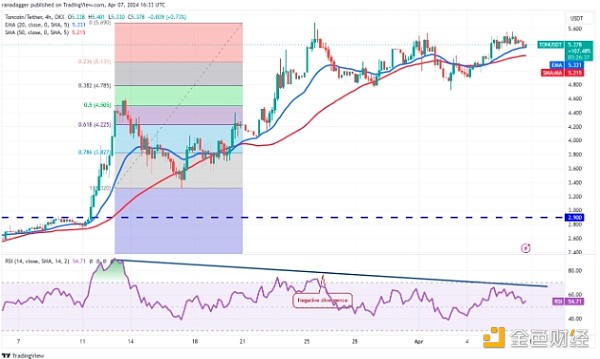
TON/USDT 4-hour chart. Source: TradingView
The 4-hour chart shows that the price has been fluctuating between $5.60 and $4.72 for a while. The moving averages have started to gradually turn up, suggesting that bulls have the upper hand. This strengthens the prospects of a breakout above $5.69. If this happens, the pair could climb to $6.48.
On the other hand, if the price declines sharply and breaks below the moving averages, it would suggest that the range-bound movement is likely to continue for a while. If the price breaks below $4.72, bears will have the upper hand.
Stacks Price Analysis
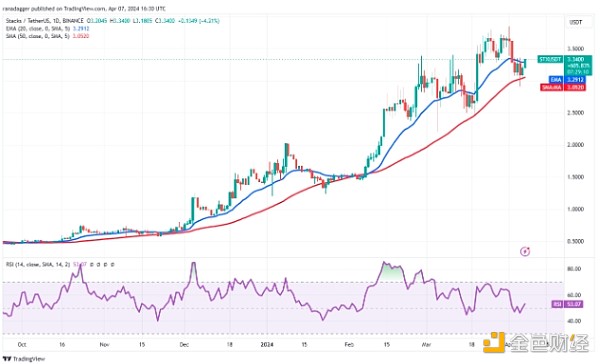
STX/USDT Daily Chart. Source: TradingView
If the price rises above $3.36, it will suggest that the bulls have absorbed the supply. This will increase the possibility of a rally to the overhead resistance at $3.84. If this level is cleared, the STX/USDT trading pair could move up to $4.27 and subsequently to $5.
Contrary to this assumption, if the price turns down and breaks below the 50-day moving average, it will suggest that the bears are overpowering the bulls. This could start a further correction to $2.50 and subsequently to $2.20.
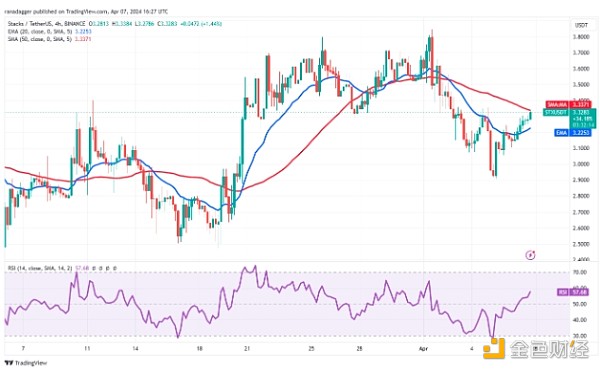
STX/USDT 4-hour chart. Source: TradingView
The bulls have pushed the price above the 20-MA on the 4-hour chart, which suggests that the selling pressure is easing. If the buyers maintain the momentum and push the price above the 50 SMA, the pair might attempt a rally to $3.60 and subsequently to $3.84.
Alternatively, if the price turns down from the 50 SMA, it will suggest that the bears are selling on rallies. A break below $3.05 will strengthen the bears and the selling may accelerate below $2.90.
Mantle Price Analysis
Mantle (MNT) has been facing resistance at $1.50 but a positive sign is that the bulls have not allowed the price to sink below the 20-day EMA ($1.18).
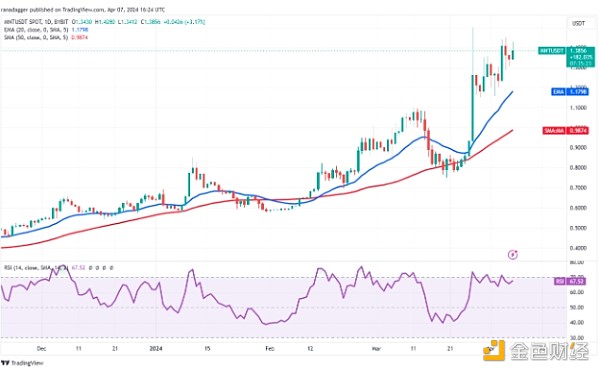
MNT/USDT daily chart. Source: TradingView
The bulls will once again try to retest the overhead resistance at $1.50. The upsloping 20-day EMA and the RSI near the overbought zone suggest that the path of least resistance is to the upside. If the buyers break the $1.50 barrier, the MNT/USDT trading pair could start a rally to $1.90.
On the contrary, if the price turns down from $1.50, it will suggest that the bears are selling on rallies. The pair could drop to the 20-day EMA. A break below this support will signal the start of a deeper correction.
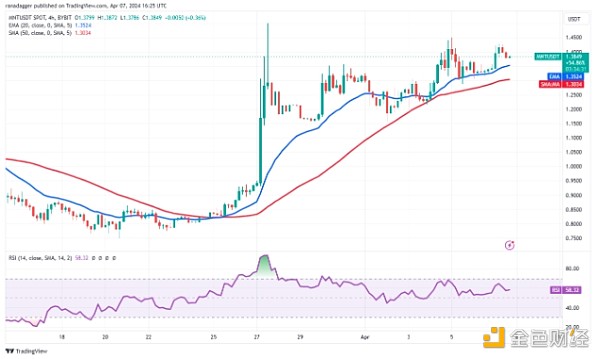
MNT/USDT 4-hour chart. Source: TradingView
Both moving averages are gradually turning higher on the 4-hour chart and the RSI is in the positive territory, suggesting that buyers remain in control. There is a minor resistance at $1.45, but if it is crossed, the pair could climb to $1.50.
The 50-MA remains a key support to watch on the downside. A break below this support will indicate that the bulls are losing control. The pair could then drop to the strong support near $1.15.
Maker Price Analysis
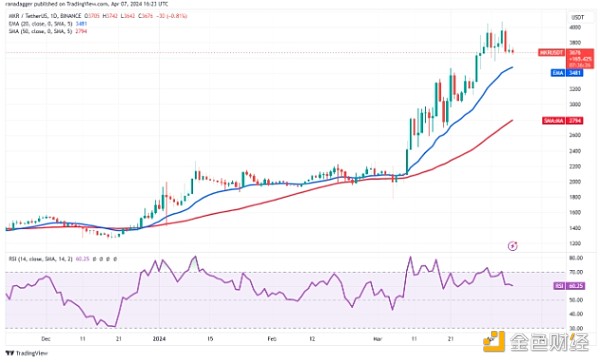
MKR/USDT daily chart. Source: TradingView
The MKR/USDT pair could pullback to the 20-day EMA ($3,481), which is an important level to watch. If the price rebounds off this support, it will show that market sentiment remains positive and traders are buying on dips. Subsequently, the pair is likely to retest the overhead resistance at $4,074. If it breaks above this level, the pair is likely to accelerate towards $5,280.
Conversely, a break below the 20-day EMA will suggest that the bulls are in a rush to exit. The pair is likely to drop to the 50-day SMA ($2,794) later.
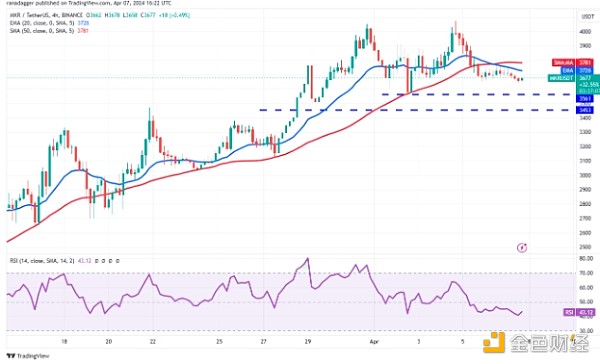
MKR/USDT 4-hour chart. Source: TradingView
The pair has broken below the moving averages on the 4-hour chart, which suggests that the bears are trying to take control. The pair could drop to $3,561 and below it to $3,453, the bulls will try to stall the decline. If the price rebounds off the support, it will suggest that the pair might consolidate for a while.
Conversely, a break below $3,453 could start a correction towards $3,000 and $2,700. The uptrend is likely to resume on a close above $4,074.
Live Updates
- Jun 25, 2024 4:22 pmAevo: Second Airdrop Project AZUR Token Claims Now OpenAccording to Aevo’s official post on the X platform, the second phase of the platform’s airdrop project AZUR is now open for application. Users who meet the Azuro Aevo Airdrops qualifications can receive token rewards. This airdrop is mainly aimed at Aevo pledgers and Aevo pre-market traders. Eligible wallets must have ETH on the Ethereum mainnet to complete the application.
- Jun 25, 2024 4:14 pmMarc Cuban wallet seen dumping NFTs after 2 years of inactivityMarc Cuban’s wallet sold 14 NFTs for $38,500 and listed two more NFTs for sale for about $66,000. source: https://cointelegraph.com/news/marc-cuban-nft-sales-2024
- Jun 25, 2024 4:13 pmHere are the Stars of the Day: While Bitcoin is Trying to Recover, Whales Bought the Most from These Altcoins in the Last 24 Hours!While Bitcoin was recovering, according to Nansen data, whales bought altcoins named Polygon (POL), Ethereum (ETH), WETH and ENA. Continue Reading: Here are the Stars of the Day: While Bitcoin is Trying to Recover, Whales Bought the Most from These Altcoins in the Last 24 Hours! source: https://en.bitcoinsistemi.com/here-are-the-stars-of-the-day-while-bitcoin-is-trying-to-recover-whales-bought-the-most-from-these-altcoins-in-the-last-24-hours/
- Jun 25, 2024 4:10 pm인투더블록 : 이더리움 재단, 역사적으로 고점에 매도했지만 아직까지는 큰 매도 없어인투더블록 X : “역사적으로 각 강세장 동안 재단은 전략적으로 상당한 금액을 판매했으며, 종종 이러한 판매는 시장 최고점과 거의 완벽하게 일치했다. 현재 주기에서 이더리움 재단은 아직 상당한 판매를 실행시키지 않았다. 이는 정점이 아직 오지 않았다는 뜻일까? 아니면 재단이 방식을 바꾸었을까?” 이더리움 재단 지갑의 USD 순흐름 ▼ 독일 정부, 400 BTC를 거래소로 입금 25일 암호화폐 시장동향 .. ... source: https://coincode.kr/21606
- Jun 25, 2024 4:10 pmهذه المرة لن تجر Mt. Gox سعر البيتكوين للهبوط!يتوقع المحللون اضطرابات أقل في السوق مما كان متوقعًا في البداية مع بدء Mt. Gox في تسديد المستحقات للدائنين في يوليو 2024. هذا التطور حاسم لسوق العملات المشفرة، الذي شهد مؤخرًا تقلبات كبيرة. كانت Mt. Gox في وقت من الأوقات بورصة بيتكوين رائدة، وقد واجهت إفلاسًا في 2014، تاركةً آلاف الدائنين في حالة من عدم اليقين. للحصول على خدمة إعلانية لمشروع الكريبتو الخاص بك أو البيانات... source: https://ar.beincrypto.com/68422/
- Jun 25, 2024 3:49 pmأهم أخبار العملات المشفرة هذا الأسبوع: إيردروب بلاست.. ومناظرة جو بايدن والمزيدهذا الأسبوع، استحوذت بعض الأخبار الرئيسية على اهتمام المستثمرين والمتحمسين للعملات المشفرة على حد سواء. يتوقع المراقبون أن تؤثر هذه التطورات بشكل كبير على قطاع التمويل اللامركزي (DeFi) وصناعة العملات المشفرة بشكل أوسع. للحصول على خدمة إعلانية لمشاريع الكريبتو إطلاق إيردروب Blast ستطلق Blast، وهي شبكة من الطبقة الثانية (L2) على إيثريوم، الإيردروب الخاص بها المنتظر في الأسبوع المقبل في... source: https://ar.beincrypto.com/68078/
- Jun 25, 2024 3:29 pmDePin Tokens Outperform as the Crypto Market BleedsDecentralized physical infrastructure network (DePin) tokens have surged in the last 24 hours, outperforming the broader crypto market. After Bitcoin’s decline to below $58,500, DePin tokens strongly rebounded. This sector represents not just the cutting edge of technological adaptability but also a promising frontier for investors seeking to capitalize on the next wave of crypto-led... source: https://beincrypto.com/depin-tokens-soar-bitcoin-struggles/
- Jun 25, 2024 3:29 pmDePinトークン、暗号資産市場の出血でアウトパフォーム分散型物理インフラネットワーク(DePin)トークンは過去24時間で急騰し、より広範な暗号資産をアウトパフォームした。ビットコインが58,500ドルを下回るまで下落した後、DePinトークンは強く反発した。 このセクターは、技術的適応性の最先端を表しているだけでなく、暗号資産主導のイノベーションの次の波に乗ろうとする投資家にとって有望なフロンティアでもある。 Arweave、Render、Akash NetworkがDePinの反発を牽引 CoinMarketCapによると、DePinセクターは過去24時間で7.49%増加した。時価総額は現在258億ドルとなっている。 時価総額に基づくDePinトークンのトップ10の中で、Arweave (AR)は過去24時間で12.71%上昇し、トップパフォーマーとなっている。続いてRender... source: https://jp.beincrypto.com/depin-tokens-soar-bitcoin-struggles/
- Jun 25, 2024 3:16 pmSwarm Marketsの金担保NFTが現実世界の資産トークン化分野を拡大トークン化は、伝統的な市場とデジタル資産市場を結びつけることで、投資の世界を変えようとしている。この変革の一環として、ベルリンを拠点とするプラットフォームであるSwarm Marketsは、金に裏打ちされた非金融性トークン(NFT)を発売する予定だ。 この商品は、ブロックチェーン技術の実用的かつ斬新な応用を提供する。 コンプライアンスの確保Swarm Marketsの金担保NFTへのアプローチ Swarm Marketsは、金担保NFTによる実物資産(RWA)のトークン化を主導しています。この取り組みにより、ロンドンに拠点を置くブリンクの金庫に安全に保管されている現物の金の所有権を表すNFTを個人が購入できるようになります。 Swarm... source: https://jp.beincrypto.com/swarm-markets-gold-backed-nfts-rwa-tokenization/
- Jun 25, 2024 3:16 pmSwarm Markets’ Gold-Backed NFTs Expand Real-World Asset Tokenization SectorTokenization is changing the investment world by connecting traditional and digital asset markets. As a part of this transformation, Swarm Markets, a Berlin-based platform, is set to launch gold-backed non-fungible tokens (NFTs). This product offers a practical and novel application of blockchain technology. Ensuring Compliance: Swarm Markets’ Approach to Gold-Backed NFTs Swarm... source: https://beincrypto.com/swarm-markets-gold-backed-nfts-rwa-tokenization/


